Analysis Options Menu
From Eigenvector Documentation Wiki
The Analysis GUI Edit/Options menu provides access to the following options and preferences items:
Contents |
Method Options
Controls settings specific to the currently selected analysis method. Typically these options include things like confidence limits settings, algorithm selections, and constraints. Some analysis methods have more settings than others. These options are also accessible through the options button on the Analysis toolbar ![]()
Analysis GUI Options
Controls for the general Analysis GUI are accessed here, including the maximum number of factors available in factor-based models, the default import method used by the Status Pane, whether features like the automatic factor selection are available, and other general display features. The description of these options are given on the options page.
Model Cache Settings
Controls for the Model Cache. See that model cache page and the modelcache function for details on the options available.
Default Plots
Manage the default scores plots created. This GUI allows selection of which plots should be created when the Scores button is clicked in any of the factor-based analysis methods (PCA, PLS, CLS, etc.) By default, Analysis GUI shows the plots which are considered most useful for the given method. In some cases, you may want to disable or change these defaults based on the kind of data you are working with or the plots you find you use the most.
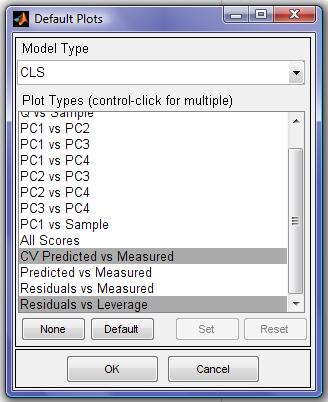
In this GUI, simply select one of the model types from the provided list, then select which type(s) of plots you want to show with the model type. Keep in mind that not all plots will be available with all model types. Any selection which is invalid will be replaced with a default plot.
To disable automatic plots, click on the None button. To return to the factory-default plots, click the Default button.
When done changing settings for a given model type, click "Set" to save your changes for that model type or "Reset" to discard your changes for that model type. When done changing all settings, click "OK" to save the settings and exit. Clicking "Cancel" at any time will discard all changes made to defaults while the GUI was open.
Window Docking Settings
Controls the general window docking settings. By default Solo and PLS_Toolbox are multi-window-based applications (each control and data figure appears in its own window.) Some users prefer to have all windows appear "docked" inside a single frame (e.g. to allow easier switching between applications.) These options allow the user to choose the general behavior they want. They include the default separate windows for all figures and GUIs; Docking of data figures, but free-floating GUIs; And docking of all data figures and GUIs.
When switching to "all docked" mode, GUIs which are already opened may not be docked until when they are opened again. In all cases, you can force a window to dock by clicking on the small curved arrow in the upper-right-hand corner of any figure or GUI.
Note: This features is not available when using PLS_Toolbox in earlier versions of MATLAB.
Preferences Expert
Provides access to low-level program configuration. The Preferences Expert allows users access to override any function's default options. These options and settings can be useful for accessing unique PLS_Toolbox and Solo features, but can also cause some unexpected behavior or errors. Please read the directions for the Expert Preferences GUI carefully before using this feature. If you have any questions, please review the options documentation for the specific function you are modifying.