Half-Normal Probability Plot
From Eigenvector Documentation Wiki
The following describes the Half-Normal Probability plot for analyzing Design of Experiments results with MLR.
Contents |
Half-Normal Probability Plot
Usage
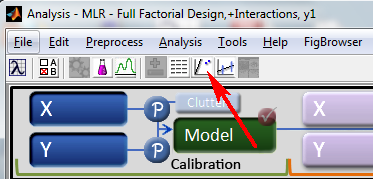
Half-Normal plots are used to identify which experiment factors have important effects on the response. Clicking on the 'Half-Norm' menu button will open a Half-Normal probability plot.
Interpretation
This plot shows the magnitude of the experiment's effects as “Standardized Effects”, ordered in increasing magnitude, along the x-axis. The Standardized Effect for a factor is the difference of the average response variable over "high" factor levels minus the average response over the "low" factor levels. The y-values are not based on the DOE data. They are given by the idealized expected values for this number of effects, ranked by increasing value, if they were drawn from a half-normal distribution. Thus, the y-value for the jth effect is the half-normal probability value for the jth value (rank) in a variable with N observations. A half-normal distribution is the distribution of the abs(X) with X having a normal distribution with mean zero.
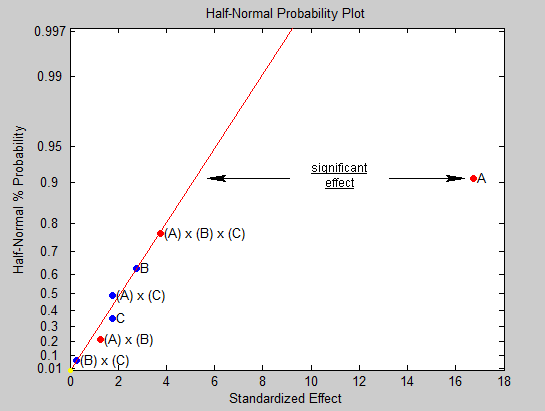
The plot contains a straight red line which is drawn through the expected values of N effects if all of the effects are small. Factors having small effects will be plotted near the plot’s straight red line. Factors having large effects will be plotted farther to the right. This is how important effects are identified in the Half-Normal plot. Factor A is likely to be an important effect for the DOE shown in the figure below because its data point lies well off the straight red line. The other effects are likely to have unimportant effects since they lie close to the red line. The color of the data points indicates whether the effect is positive (red) or negative (blue), so experiments with "high" levels for factor A will have larger responses than similar experiments having "low" levels for factor A.
Note that the y-values are half-normal "z" values in the range (0, inf) but the axis is labeled using the corresponding half-normal cumulative distribution function values for convenience.
Further information
For more information on Half-normal Probability plots see:
http://www.itl.nist.gov/div898/handbook/pri/section5/pri598.htm