| PLS_Toolbox Documentation: plotgui | < ploteigen | plotloads > |
plotgui
Purpose
Interactive data viewer.
Synopsis
fig = plotgui(data)
fig = plotgui(data,'PropertyName',PropertyValue,...)
fig = plotgui('update','PropertyName',PropertyValue,...)
Description
Plots input data dat and provides a control toolbar in the Plot Controls window to select portions of the data to view. The toolbar allows interactive selection, exclusion, and classing of rows or columns of data. The PLOTGUI command has various display options that are given as 'PropertyName', PropertyValue pairs or as a single keyword. Properties and Keywords are discussed below. To modify options for an existing PLOTGUI figure without providing new data, use the 'update' keyword.
PLOTGUI returns the handle of the figure in which the data is displayed (fig).
Input dat can be class “double” or “dataset”. The description given below is generally listed for two-way data arrays. Options specific to data that are three-way or image are noted explicitly. PLOTGUI uses the dataset labels, classes, etc. when dat is class “dataset”.
Plot Controls Toolbar
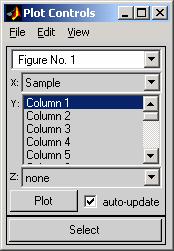 The toolbar consists of 1) a menu bar with File, Edit,
and View menus, 2) a figure selection dropdown menu, 3) three axis menus
(labeled x, y, and z), 4) plot update controls Plot
button and auto-update checkbox, and Select button.
The toolbar consists of 1) a menu bar with File, Edit,
and View menus, 2) a figure selection dropdown menu, 3) three axis menus
(labeled x, y, and z), 4) plot update controls Plot
button and auto-update checkbox, and Select button.
Each figure in the figure selection dropdown menu menu can be modified by the PLOTGUI controls. Selecting a figure from this menu will bring that figure into view and indicate the selected axis menu settings. A "+" or a "*" next to a figure's name indicates that it is linked with another figure (see Duplicate Figure below).
The axis menus (labeled x, y, and z) select what parts of the data should be used for the plot. Each column or row selected in the y-axis menu will be plotted against the column, row or index selected in the x-axis menu. If any selection is made on the z-axis menu, then each y-axis selection is also plotted against the column or row selected in the z-axis menu to make a three-dimensional plot.
If the input dat is three-way it is assumed to be a multivariate image, and the y-axis is slice or slab and the figure default is imagesc(dat(:,:,1)). This is also true if dat is class “dataset” with the type field set to 'image' or 'image'.
If the auto-update checkbox is selected, figures are updated automatically when new axis-menu selections are made. Otherwise, the Plot button must be pressed before any changes are reflected in the figure.
View Menu
Various options associated with the viewed data are contained in the View menu. The specific options depend on the data being plotted. The View menu options are listed below.
Selection using the Select button
The Select button allows the user to select plotted points in the current figure. After clicking Select, the current figure will be brought to the front and points are selected using the current selection tool (see Edit menu below). To extend a selection (i.e. add new points to the already selected points), use the shift-key while pressing the mouse button. To remove points from the selection, use the control-key while pressing the mouse button. To keep from making any selection, press "Esc" or "Escape".
Edit Menu
The Edit menu contains various actions relating to selections. The specific actions available depends on the current selection and PLOTGUI mode. The Edit menu options are listed below.
File Menu
The File menu contains various actions relating to files. The File menu options are listed below.
Properties and Keywords
The following is a list of available properties. Each should be included as a 'PropertyName', PropertyValue pair in an initial PLOTGUI call or a PLOTGUI 'update' call. Note that calls to PLOTGUI for 'PropertyName' and PropertyValue are case insensitive.
The current value of almost all properties can be retrieved using the getappdata function on the PLOTGUI figure and requesting the property of interest. Note that calls to GETAPPDATA are case sensitive and 'PropertyName' must be in all lower-case. The I/O format is:
currentvalue = getappdata(fig,'propertyname')
where fig is the handle of the PLOTGUI figure. If 'propertyname' is not included getappdata(fig) will list all the properties and their current values. Properties and their possible values follow:
AxisMenuValues: {[x] [y] [z]}, Two or three element cell containing indices or strings indicating which item, or items, to select in each of the three axis pull down menus. In [x] or [y] a value of 0 (zero) means to select index number. In [z] a value of 'none' means to not use the z-axis.
AxisMenuDefaults: Axis menu defaults are axis menu values used if the axis menu values can not be restored. The input format is the same as axismenuvalues.
Figure: [scalar integer], Figure on which data should be plotted {default is current figure}.
New: Key word – no associated PropertyValue. Creates a new figure for display of data. This is equivalent to an initial PLOTGUI call.
PlotBy: [scalar integer], Dimension (mode) for the axis menu selections: 0 = data summary, 1 = rows, 2 = columns, etc. (see View menu). The default is 2 or the number of modes in the data if larger than 2-way.
VSIndex: [ 1 1] {default}, Two element vector indicating if "Index" should be offered on x and y axis menus. A 1 indicates that it should be offered as a selection and a 0 indicates that it should not e.g. [1 1] indicates that it should be offered for both the x-axis and y-axis.
The following are image specific properties:
Image: Key word – no associated PropertyValue. Unfolds a 2 or 3-way array and displays it as and image, allowing selection, classing, and exclusion of individual pixels.
Unfold: Key word – no associated PropertyValue. Pseudonym for “image”.
AsImage: Key word – no associated PropertyValue. Display 3-way data that have already been unfolded as an image allowing selection, classing, and exclusion of individual pixels.
The following are view properties:
ViewExcludedData: [1] {default}, Turns on View/Excluded Data menu. A 0 (zero) turns it off.
The following are plot properties:
SelectionMarker: <string>, Defines marker style for selected points (see PLOT).
The following are selection properties:
The following are on-event properties:
CloseGUICallback: Command(s) to execute when the figure is closed.
IncludChangeCallback: Command executed when includ field of the dataset is modified.
InfoReqCallback: Command executed when information on a selected point is requested.
PlotCommand: Command executed after plotting (e.g. draw limits, assign ButtonDownFcns, modifiy axes, …).
SelectionChangeCallback: Command executed when a selction is made.
SetClassCallback: Command executed when the class field of the dataset is changed.
The following are confidence limit properties:
The following are figure linking properties (WARNING! Modifying these settings can lead to unexpected results!):
The following are other miscellaneous properties:
The following are read-only properties. These properties can only be viewed and are only accessible through the MATLAB getappdata command.
The following are other valid figure properties. See the MATLAB doc umentation on FIGURE properties for additional information.
HandleVisibility, MenuBar, Name, NumberTitle, Position, Resize, Tag, ToolBar, Units, UserData, Visible, WindowStyle
fig = plotgui(mydata) plots mydata allowing user to select which column(s) of mydata to plot using pull-down menus. Figure number of plot is returned.
plotgui(mydata,'plotby',1) or plotgui(mydata,'plotby','rows') plots mydata as in first example except that rows of mydata (dimension 1) are used for pull-down menus instead of columns. Note: When a PLOTGUI property is set for a given figure, the new value will be retained until a new value for that property is provided, even if new data is plotted on the same PLOTGUI figure.
fig = plotgui(mydata,'plotby',1,'axismenuvalues',{[1] [2 3]}) plots rows of mydata; sets controls with row 1 selected for the x-axis and rows 2 and 3 selected for the y-axis. Use:
getappdata(fig,'axismenuvalues')
to retrieve current axis menu settings. axispulldown
plotgui(mydata,'viewclasses',1) plots mydata using symbols to identify the classes stored in dataset mydata. Use a value of 0 (zero) to turn off viewclasses.
plotgui('update','viewclasses',1) Turns on viewclasses property for current figure without having to pass data to plot (substitute string 'update' for data)
mydata = plotgui('getdataset',fig) Retrieves mydata from figure fig.
plotgui(myimage,'image') plots 3-way image myimage selecting slabs of the image for display. The keyword 'image' allows selection, classing and exclusion of pixels in the image.
analysis, dataset/dataset, editds, gselect, modelviewer, mplot, ploteigen, plotloads, plotscores
| < ploteigen | plotloads > |