| PLS_Toolbox Documentation: cqtool | < ck_function | distfit > |
cqtool
Purpose
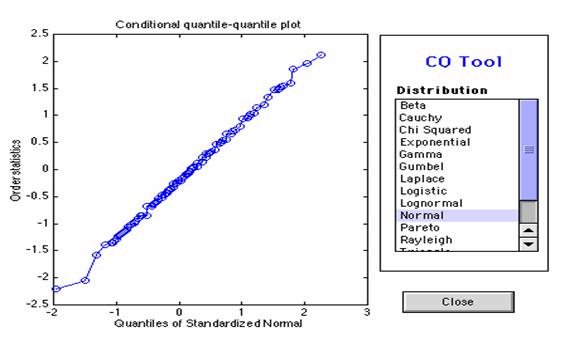
Interactive conditional quantile-quantile plot gui.
Synopsis
cqtool(x)
Description
Assesses how well a particular distribution fits the data (x). Conditional quantile plots as described in the 1986 Kafadar and Spiegelman article “An alternative to ordinary q-q plots” in Computational Statistics & Data Analysis are also available in this toolbox
INPUTS:
Examples
cqtool(x)
Note: If a sample contains all negative values, then some of the overlay distributions will not be drawn as they are not applicable. If only some of the sample is made up of negative values, these values are ignored in obtaining the maximum likelihood estimates and subsequent results.
See Also
ktool, plotcqq, plotkd, plotqq, qtool
| < ck_function | distfit > |